HOME / Posts Tagged: javascript

OMG, it’s full of cubes!
// More three.js awesomeness: here’s how to stretch test your graphics card: a three.js, WebGL demo by Ben Adams featuring up to 600.000 rotating cubes! How many frames per second do you get? (Firefox/Chrome only) See it in full screen
No, this isn’t Flash either
// Scary (in terms of the data) / awesome (in terms of the development part behind it) example of three.js, a javascript library for creating 3D scenes. See it live here
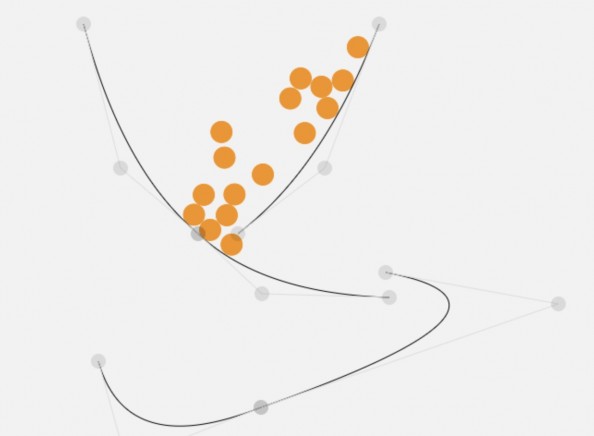
Newton’s playground: Javascript physics engines
The awesome animation below is actually the recorded output of a real-time #Javascript-powered physics engine. There has been quite a lof of progress in this field lately using technologies like #canvas and #WebGL, here are some recent developments: The “dragable/tearable cloth” demo comes from lonely-pixel.com. Play with it live and get the code here http://bit.ly/15wyK0F There are more demos on the developer’s website, [Continue reading]

This is the Internet!
// Openly accessible data + open source development + open technologies = awesome :)The people at Teehan+Lax have developed a method to create timelapse videos using imagery from Google Street View. They call it Google Street View Hyperlapse and you can see the amazing video that you can produce as well, along with links to [Continue reading]

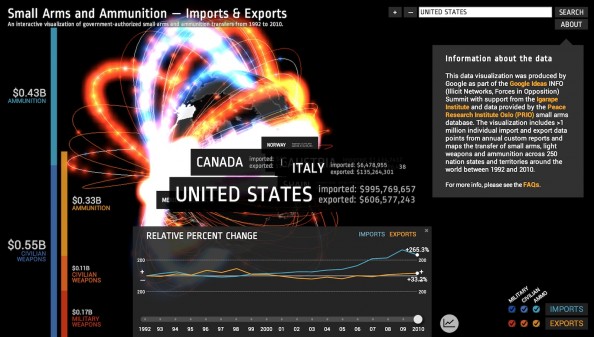
Charts with Javascript: even more ways to kill Flash
// Javascript-powered chart solutions is a favorite topic of mine, so here are a few more options for you- NVD3 (http://nvd3.org/) builds upon the powerful D3 library and currently supports 11 different interactive chart types – Rickshaw (http://code.shutterstock.com/rickshaw/) also built on D3, can be used for live-data time graphs with 4 customisable chart types _ [Continue reading]

Chart.js: cross-browser, animated, HTML5 charts
//Non-Flash charts is a favourite topic of mine (see more here http://bit.ly/g-chart), basically because charts have been one of the last things Flash could do that HTML couldn’t. This of course has been changing a lot the last few years. Another very recent (released yesterday!) example of is Chart.js. It packs: – 6 animated chart types: [Continue reading]

Photobox: CSS3/jQuery image gallery
// There are probably thousands of #lightbox solutions but here is fancy one, straight from the refreshed #jQuery #plugins site (http://bit.ly/YBFQye): Photobox promises to be a lightweight image gallery modal window script which uses only #CSS3 for silky-smooth animations and transitions. The goal was to create an image #gallery script that uses GPU rendering [Continue reading]

Going Fullscreen with HTML5
// Up until recently, having a web page running in full screen was not possible, left only for #Flash -based sites. The best you could do was remove the menu/location bars but still the window frame remained. This has changed with the #HTML5 #Fullscreen API which allows handling full-screen capability of the browser via #javascript [Continue reading]

Coming soon: Where your browser memory goes
// Currently available as part of the #devtools of the "early adopters" Canary version of #Chrome is a new feature that allows you to check what takes up the #memory that is allocated for your browser. This will certainly allow for more efficient #javascript programming. Read more about it in +Addy Osmani’s post http://bit.ly/101e2P9

Gantt charts with Javascript II
// I’ve previously (http://bit.ly/ZTPsnX) wrote about some #javascript based #gantt solutions, here are a couple more: Teamwork Gantt by Open Lab is based on #jQuery and provides features such as: in-place editing, drag&drop, zooming, do/undo, multiple dependencies, full editing, dates shortcuts, css skin, multiple browser, resources editing, multiple assignment, milestones, export data in JSON format, [Continue reading]

Organization Chart with jQuery? Done!
// One of the things I love about #jQuery is that amazing community that has produced a plethora of solutions. This means that if you have a problem, it’s quite possible that someone else has dealt with it before. If you’re looking for a #javascript solution to displaying an organization chart, Wes Nolte’s jOrgChart comes [Continue reading]

Gantt charts with Javascript
I’ve been using an old #jQuery plugin called "jquery.gantt" with limited features and it was time for an upgrade. My search ended with JSGantt, an open source #javascript solution that covers everything you would want:– Task, (collapsible) task groups & milestones– Multiple dependencies– Multiple formats (day, week, month, etc)– Data loading through XML Get JSGantt [Continue reading]