HOME / Data Visualisation
Hunting for restaurant locations in New York using Python
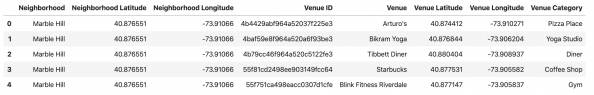
Introduction/Business Problem What follows is a presentation of a short data science task for the IBM Data Science Professional Certificate on Coursera (the related code is uploaded on GitHub). The question to be answered is finding an area in New York to open a restaurant. New York is a huge city, famous for offering any [Continue reading]
SWDchallenge: A low carb story
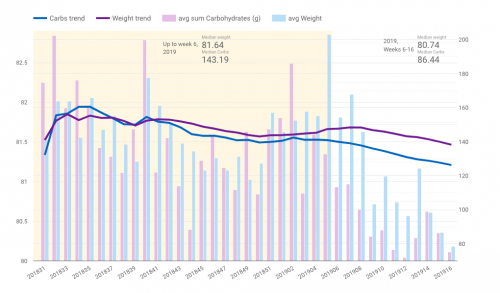
The theme of this month’s Storytelling with Data challenge is “artisanal data“. E.g. data collected personally by each participant, then analysed and visualised in a meaningful manner. I collect quite a lot of data on a daily basis tracking habits and activities. For my submission I used weight and nutrition data stored in MyFitnessPal. Particularly [Continue reading]
Emulating bubbles and shadows
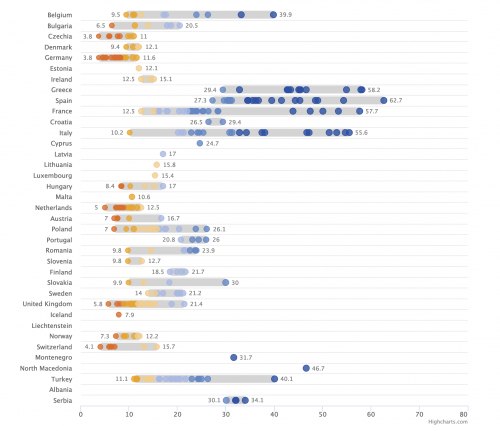
Storytelling with Data is a popular data visualisation blog by Cole Nussbaumer Knaflic. Every month Cole sets up a challenge for her readers. This month, the theme is “Emulate!”, inspired by the book Steal Like An Artist: 10 Things No One Told You About Being Creative by Austin Kleon. The idea is to recreate a [Continue reading]