Introduction/Business Problem
What follows is a presentation of a short data science task for the IBM Data Science Professional Certificate on Coursera (the related code is uploaded on GitHub). The question to be answered is finding an area in New York to open a restaurant. New York is a huge city, famous for offering any imaginable type of food. Location choice is crucial for such an endeavour, both in terms of the overall area and what type of possible customers it would attract, as well as the existing competition in the neighbourhood.
Data
From previous analysis we have a dataset of the neighbourhoods, their locations and the most common categories of venues for each of them. We have also performed some initial clustering based on the categories of venues available in each of them. This data can be used to provide possible neighbourhoods for further analysis, based on criteria that we set according to the type of restaurant that we would like to open.
We additionally can retrieve data of the venues ratings in order to analyse potential competition and find opportunities for our restaurant.
Methodology
A good location compromises of many factors. We are looking for areas that have a lot to offer in terms of various venues. Following the creation of a dataset of neighbourhoods and their locations, we used the Foursquare API to retrieve data on venues using the location of each neighbourhood.
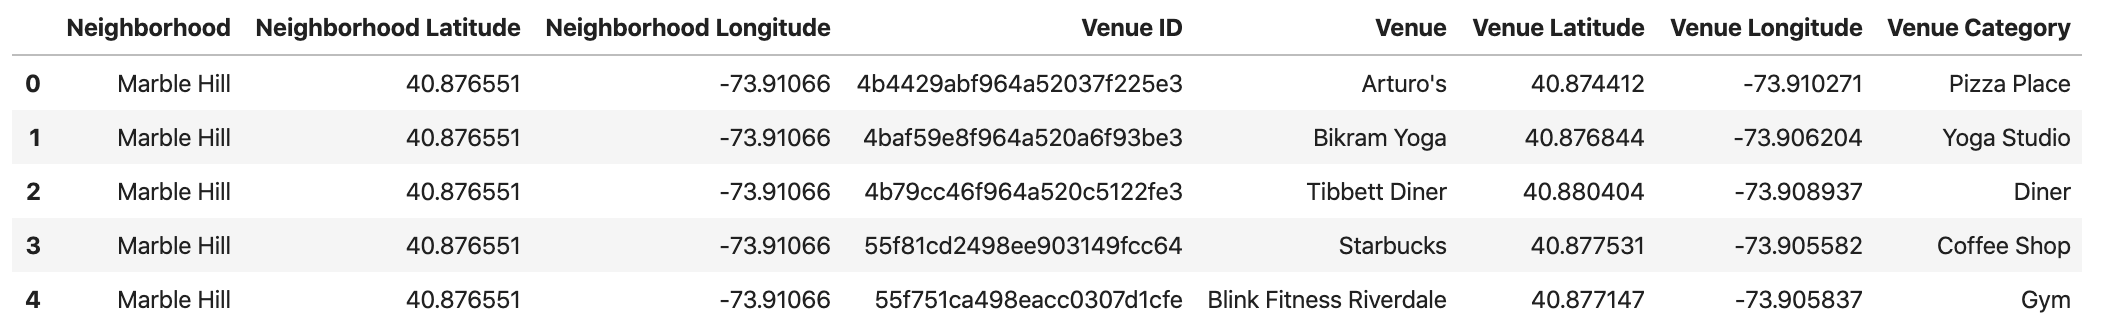
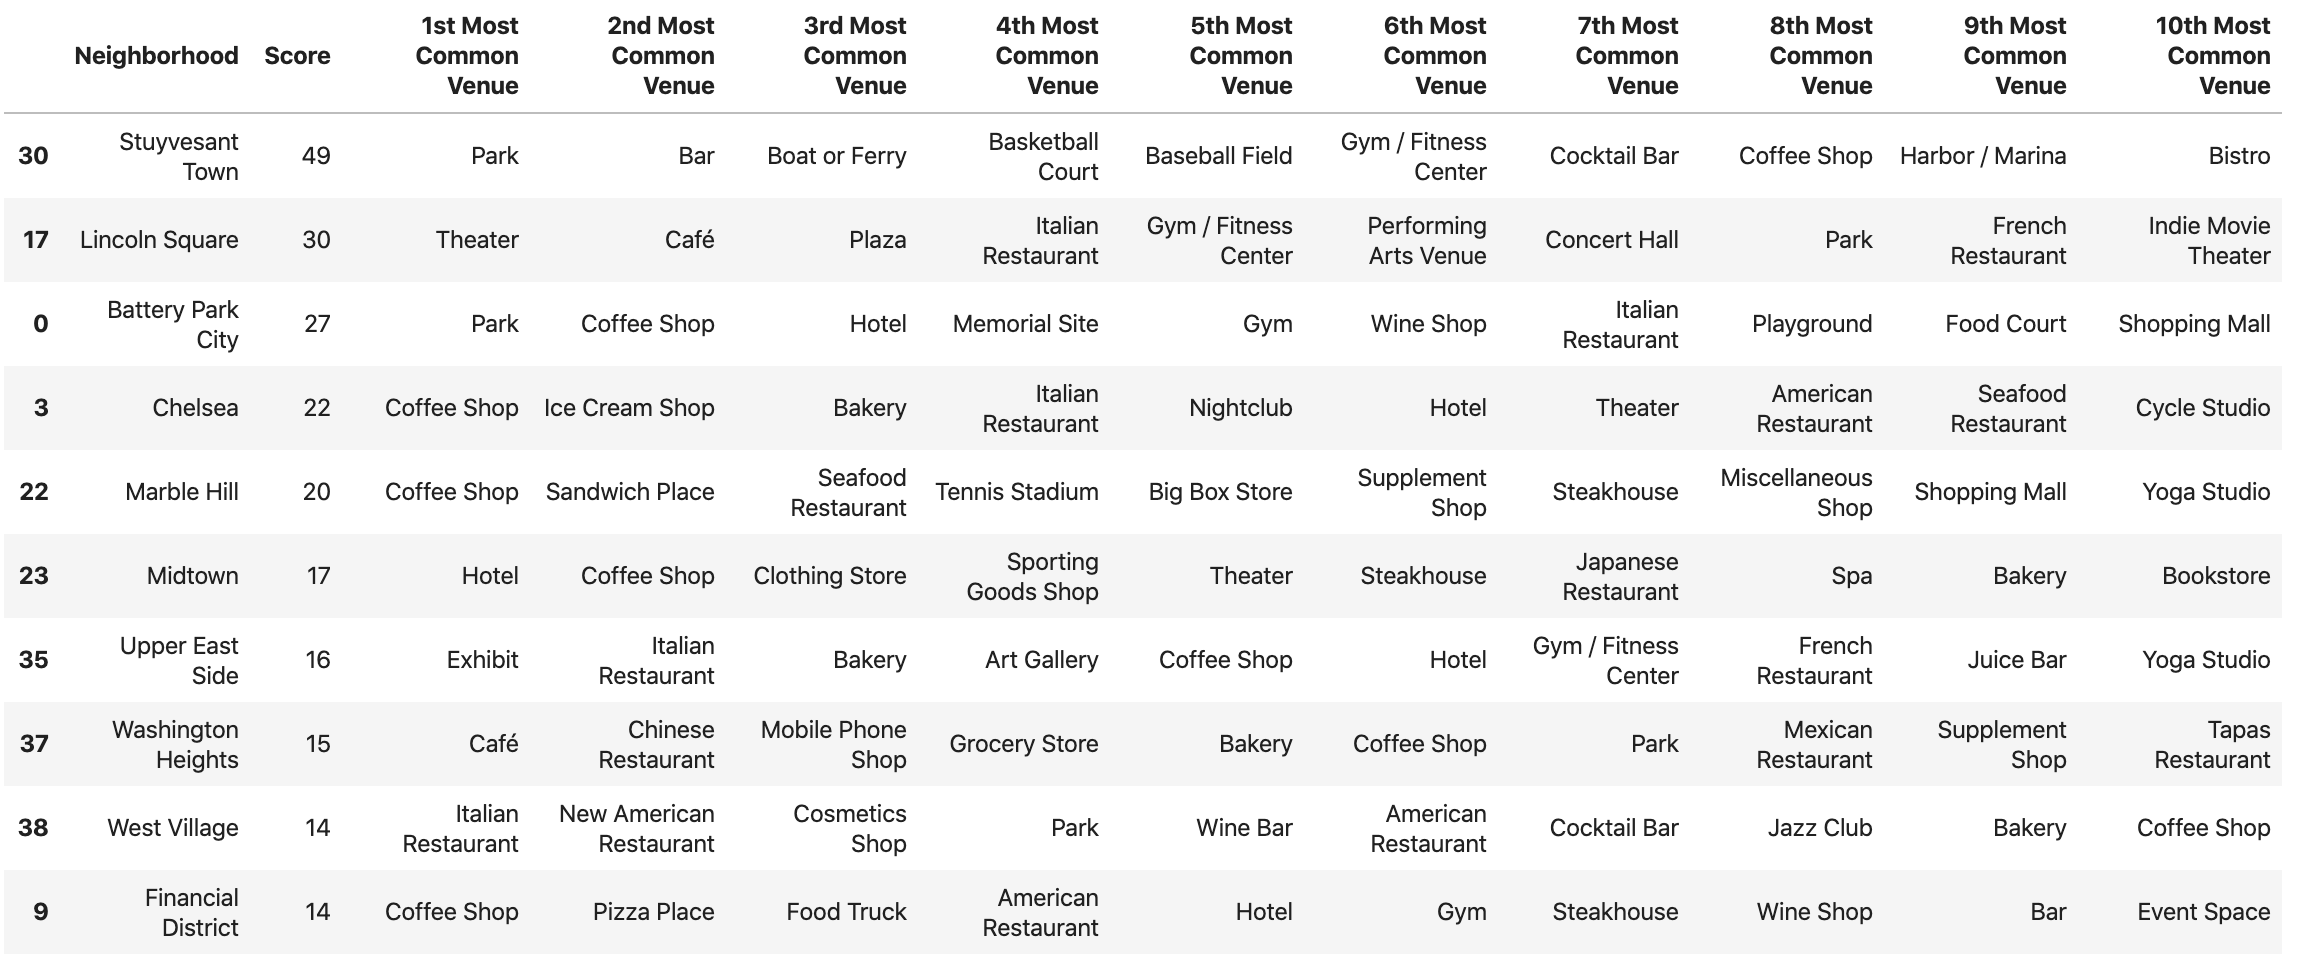
Using one hot encoding, for each neighbourhood we calculated the most common categories of venues. We also calculated a weighted score for each neighbourhood based on the types of venues located in each of them. The concept for this is that neighbourhoods with parks, tourist attractions, shopping malls or bar are bound to be good choices for a restaurant. The resulting “Top 10” of neighbourhoods was as follows:
In an additional attempt to analyse the data, we used k-means clustering to group together the neighbourhoods based on the venues categories.

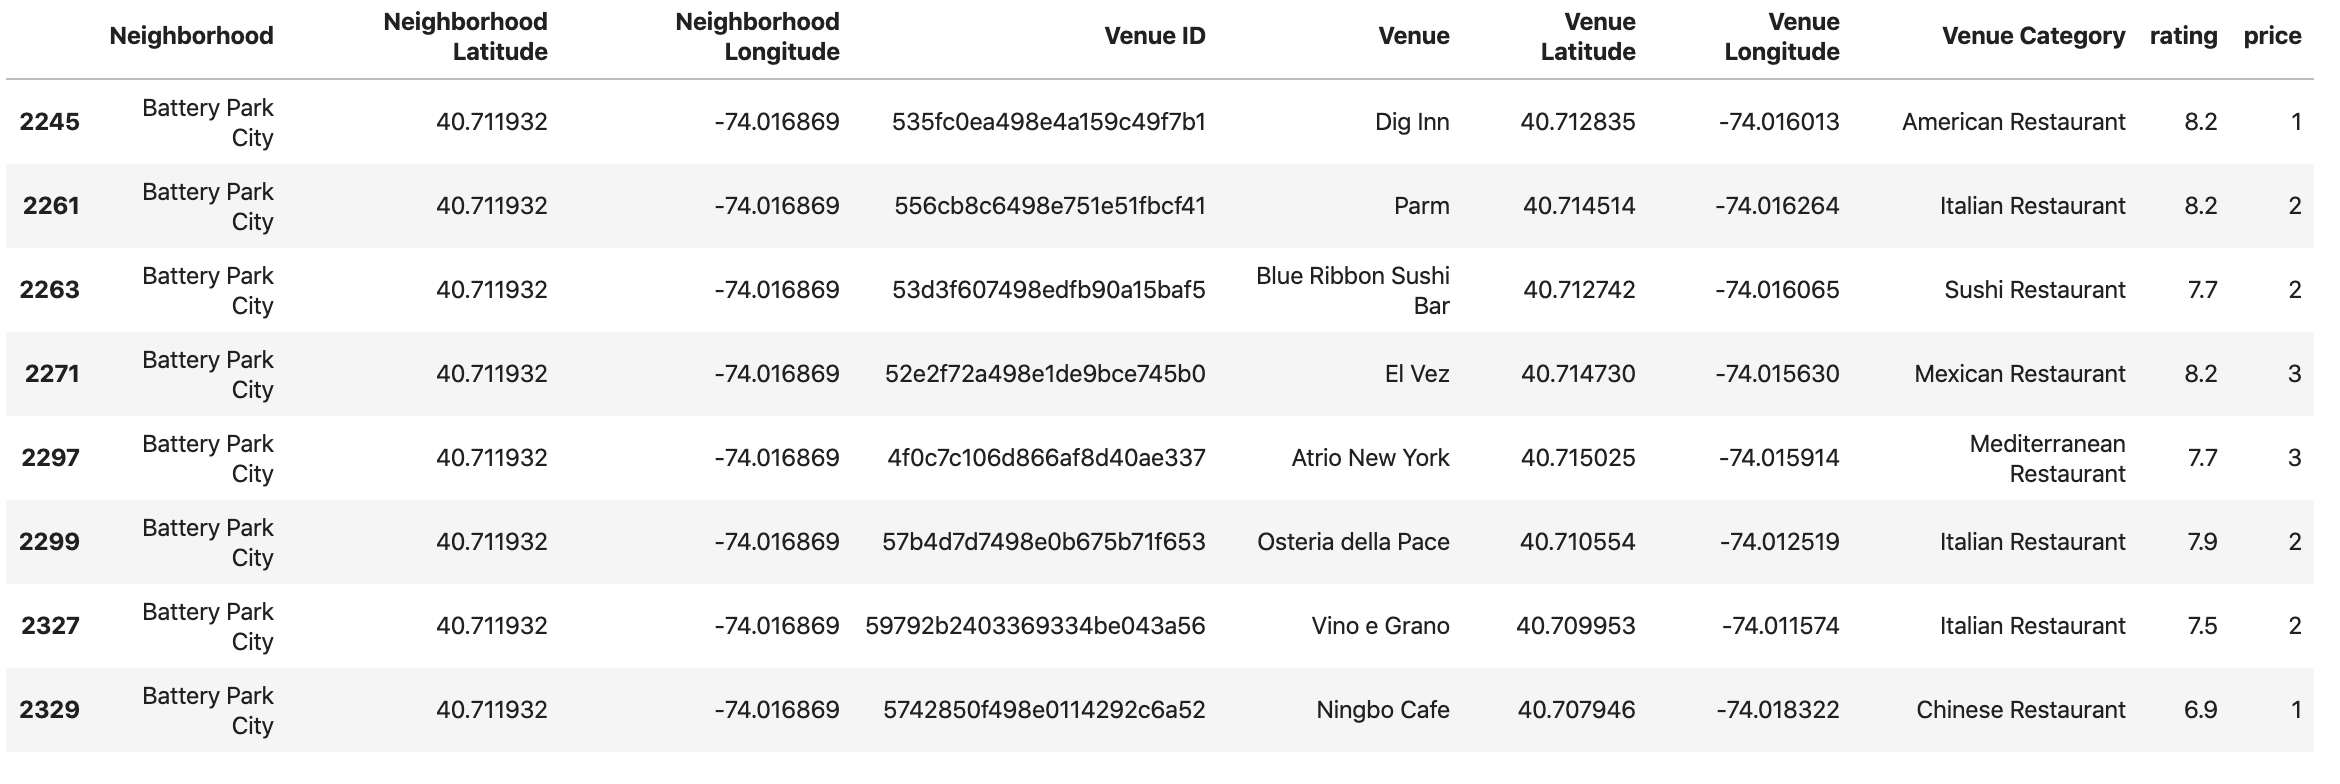
In the final part of our analysis, we examined the best scoring neighbourhoods and what kind of restaurants are in each area. Again using the Foursquare API, we examined the categories, ratings and price tiers of the restaurants in each neighbourhood.
Based on that we can provide a possible location and suggested type of restaurant.
Results
The process provided a way to evaluate various areas based on existing venues and other attractions, since Foursquare also includes location data on such things as parks, public buildings, etc. Using a weight score we were able to rank neighbourhoods based on frequency of other venues and a set of criteria for the type of area that we were looking for.
The ranking provided a top 10 list of neighbourhoods. The clustering process did not provide any further insights. Perhaps if we had combined additional data from other sources, this would be more valuable. Examining the competition (other restaurants) in the top 3 areas, Stuyvesant Town has no listed restaurants (since it is a residential area, this is to be expected), Battery Park City has several options but no French restaurant, and Lincoln Square is a highly crowded option.
So we excluded the first and third result and focused on the second top-tier option, Battery Park City.
Examining the availability of restaurants in the area, the mean rating of existing restaurants in Battery Park is 7.7875 and the mean price tier is 2.0 (which refers to a medium price tier, the highest value for this scale is 4, e.g. “Very expensive”).
We can thus argue that there would be a possibility to have an expensive (price tier of 3) or even high-end (price of 4) restaurant, with a cuisine not existing in the area, such as French or Japanese.
Discussion
The methodology provided a straightforward way to rank neighbourhoods based on frequency of venues. There is definite room for improvement in both the various scores used as well through the inclusion of additional factors into the scoring. Access to other data like crime, rent costs, parking availability, etc would provide for some deeper insights but was deemed out of scope for this task. Such additional features would also be helpful in the clustering process, which could improve the usefulness of that part of the process.
The analysis based on ratings and price tiers was a good way to examine the competition. Further examination could be done in texts of users tips. Text analysis could provide deeper insights into what the competition is doing good or missing.
It should be noted that data analysis is not merely about calculations and use of algorithms. At several points, we had to make decisions (like the score weights, or which neighbourhood to focus on from the top 3) which affected the final result. Qualitative research is as important as quantitative.
Conclusion
Searching for a restaurant location in a city of 8 million people can be a daunting task. However, data science, along with the availability of vast amounts of data with low cost of access, provides methods to hunt down opportunities and come out with fact-based options.
Tags: Data science, programming, Python


