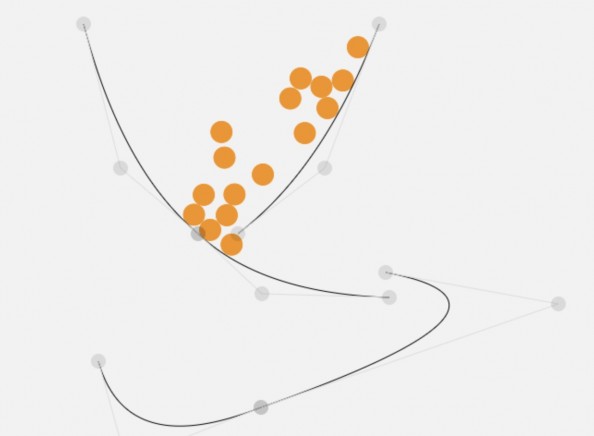
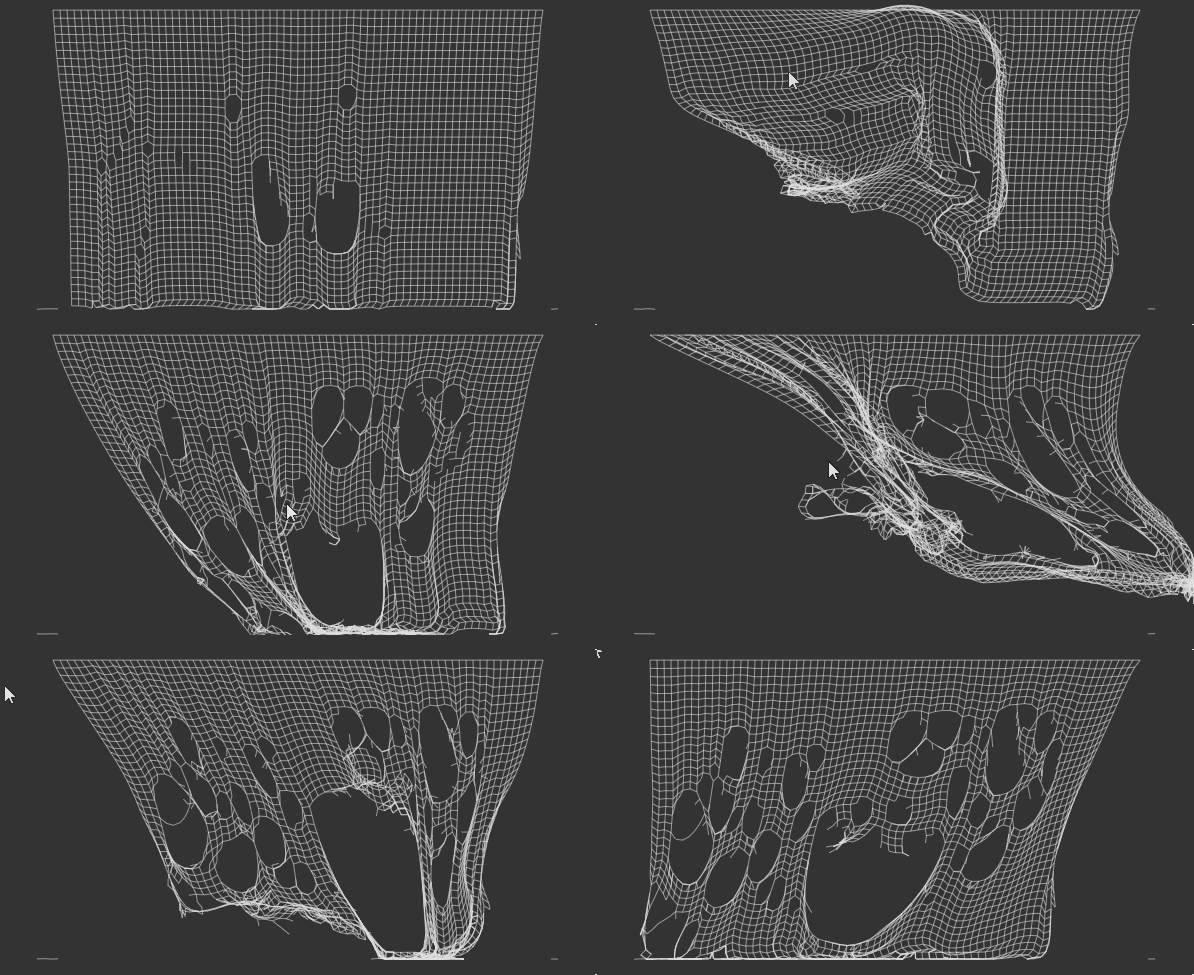
 The awesome animation below is actually the recorded output of a real-time #Javascript-powered physics engine. There has been quite a lof of progress in this field lately using technologies like #canvas and #WebGL, here are some recent developments:
 The “dragable/tearable cloth” demo comes from lonely-pixel.com. Play with it live and get the code here http://bit.ly/15wyK0F There are more demos on the developer’s website, like the above-pictured “ball curve collision” http://bit.ly/1078otN (balls fall through the curves which you can re-arrange as you like :))
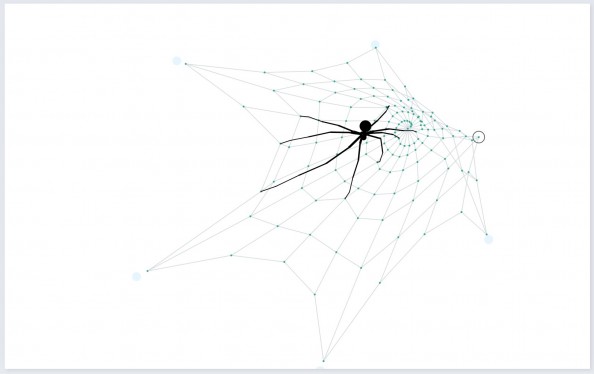
http://bit.ly/ZGWIy6 where you can push a spider around on it’s web (yes, the spider moves around on it’s own as well :))
Links via +Veljko Sekelj , +Lo Sauer and +Steve Mayne. Many thanks! :)
Tags: canvas, javascript, physics, WebGL


The D3 library is really nice. Starting to use it for a lot of visualizations. https://github.com/mbostock/d3/wiki/Gallery
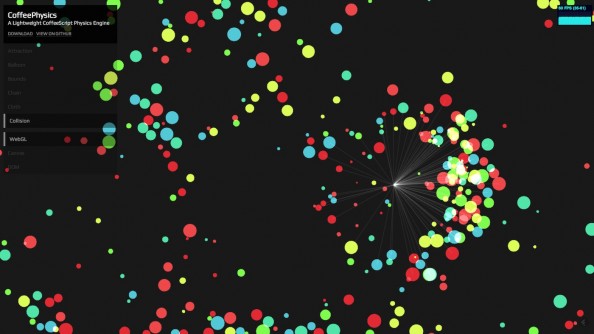
Thanks +Ian Zepp, i thought D3 was mainly used for charts and data visualisations. I see you can do a lot more, like this :) http://mbostock.github.io/d3/talk/20111018/collision.html
Exactly! I just so Happened to build this (Relationship Visualization 2013-04-23) and this (https://twitter.com/ianzepp/status/326708219944779776/photo/1) this morning in about 6 hours.
I do fundraising/donor management software for enterprises, and being able to combine social graphs with professional networking, family member relationships, and donation history is huge for the non-profit space.
BTW, the D3 demo you posted is basically a bunch of points with a negative charge, and single point over the cursor with a positive charge. It's probably only a handful of lines. And very cool.