Here is an interesting visualisation library released just a few days ago from the University Washington Interactive Data Lab.
Vega-Lite is a high-level visualization grammar. It provides a concise JSON syntax for supporting rapid generation of visualizations to support analysis. Vega-Lite can serve as a declarative format for describing and creating data visualizations. Vega-Lite specifications can be compiled to a lower-level, more detailed Vega specifications and rendered using Vega’s compiler.
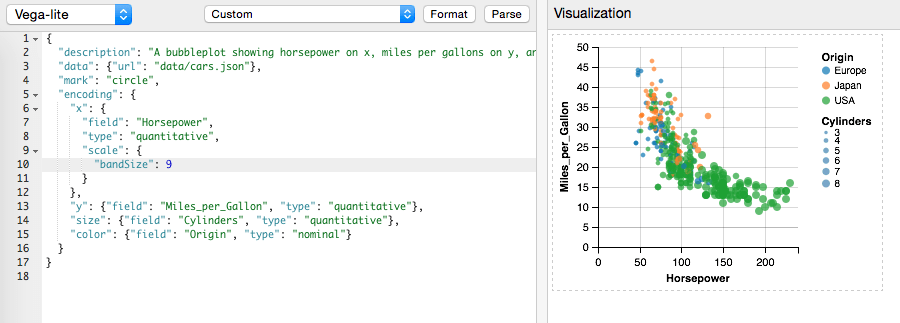
A four-indicators scatter plot (see below) can be developed with just a few lines of code (it took me around 20 minutes to produce this! :))
More examples can be seen at the Vega-Lite site
I’ll be looking to get more familiar with D3.js, here are some interesting, well-reviewed books from my to-read list
Data Visualization with D3.js Cookbook by Nick Qi Zhu
Learning D3.js Mapping by Thomas Newton
D3 Tips and Tricks: Interactive Data Visualization in a Web Browser by Malcolm Maclean
Got any other interesting libraries/frameworks for visualisations that you use? Or a book that helped you? Share in the comments :)
Also published on Medium.
Tags: d3js, datavisualisation, dataviz, HTML5, OpenSource


